DISCOVER

Live cloud architecture mapping

Connect your cloud environments and instantly visualize resources, 
relationships, and improvement opportunities with AI-driven insights.

Dashboard interface showing statistics: 5 architectures, 2436 resources, 1225 average resources per architecture, and 141 open insights, with a bar chart of insights categories and a list of top 10 resources including Server, Database, and CDN.
01

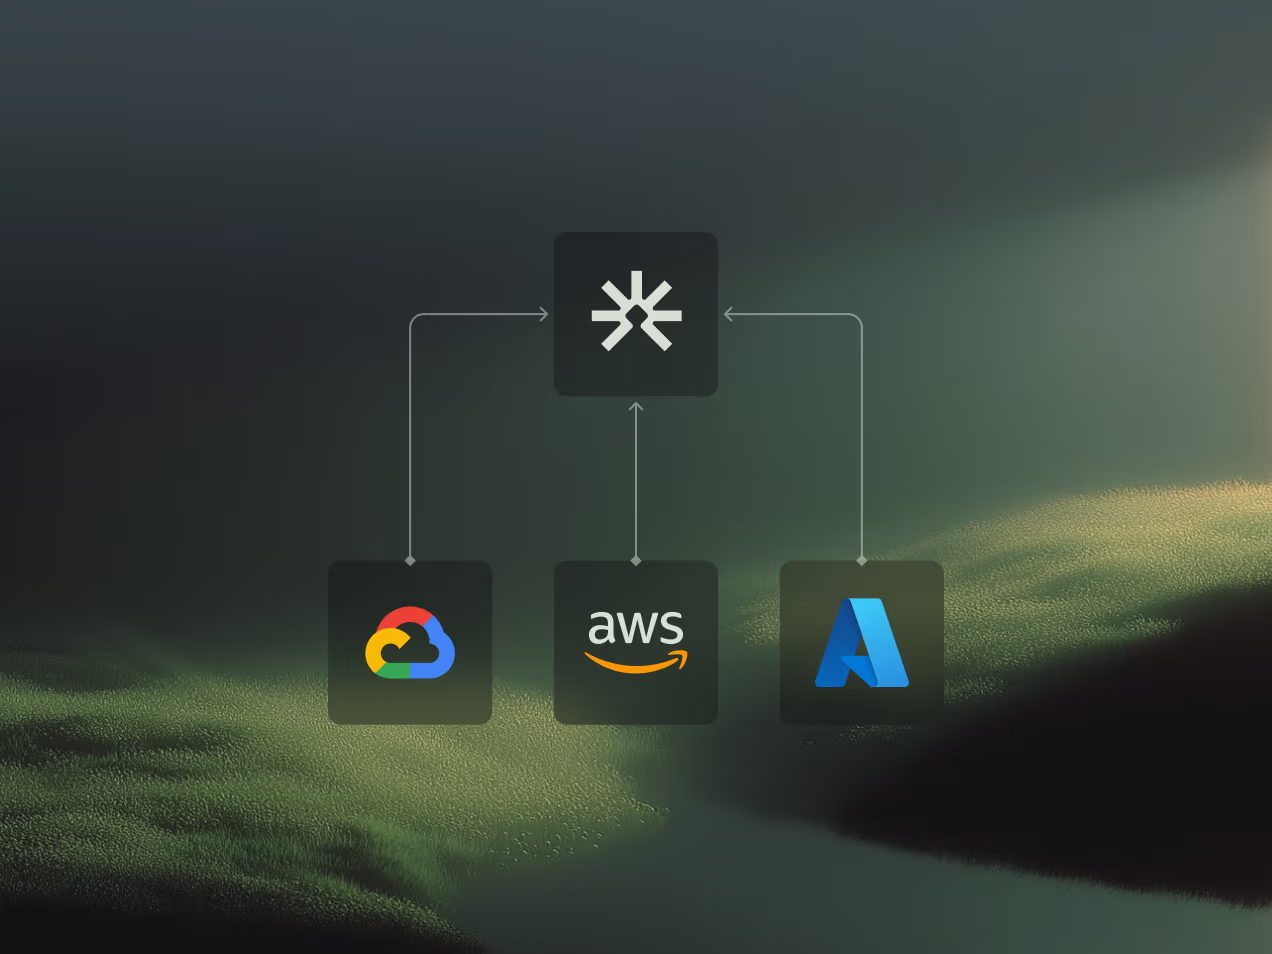
Connect your cloud in minutes

Securely connect your AWS, Azure, or GCP environments to automatically import your published architectures.

  • Supports AWS, Azure, and GCP
  • Read-only access required
  • Imports resources and relations automatically
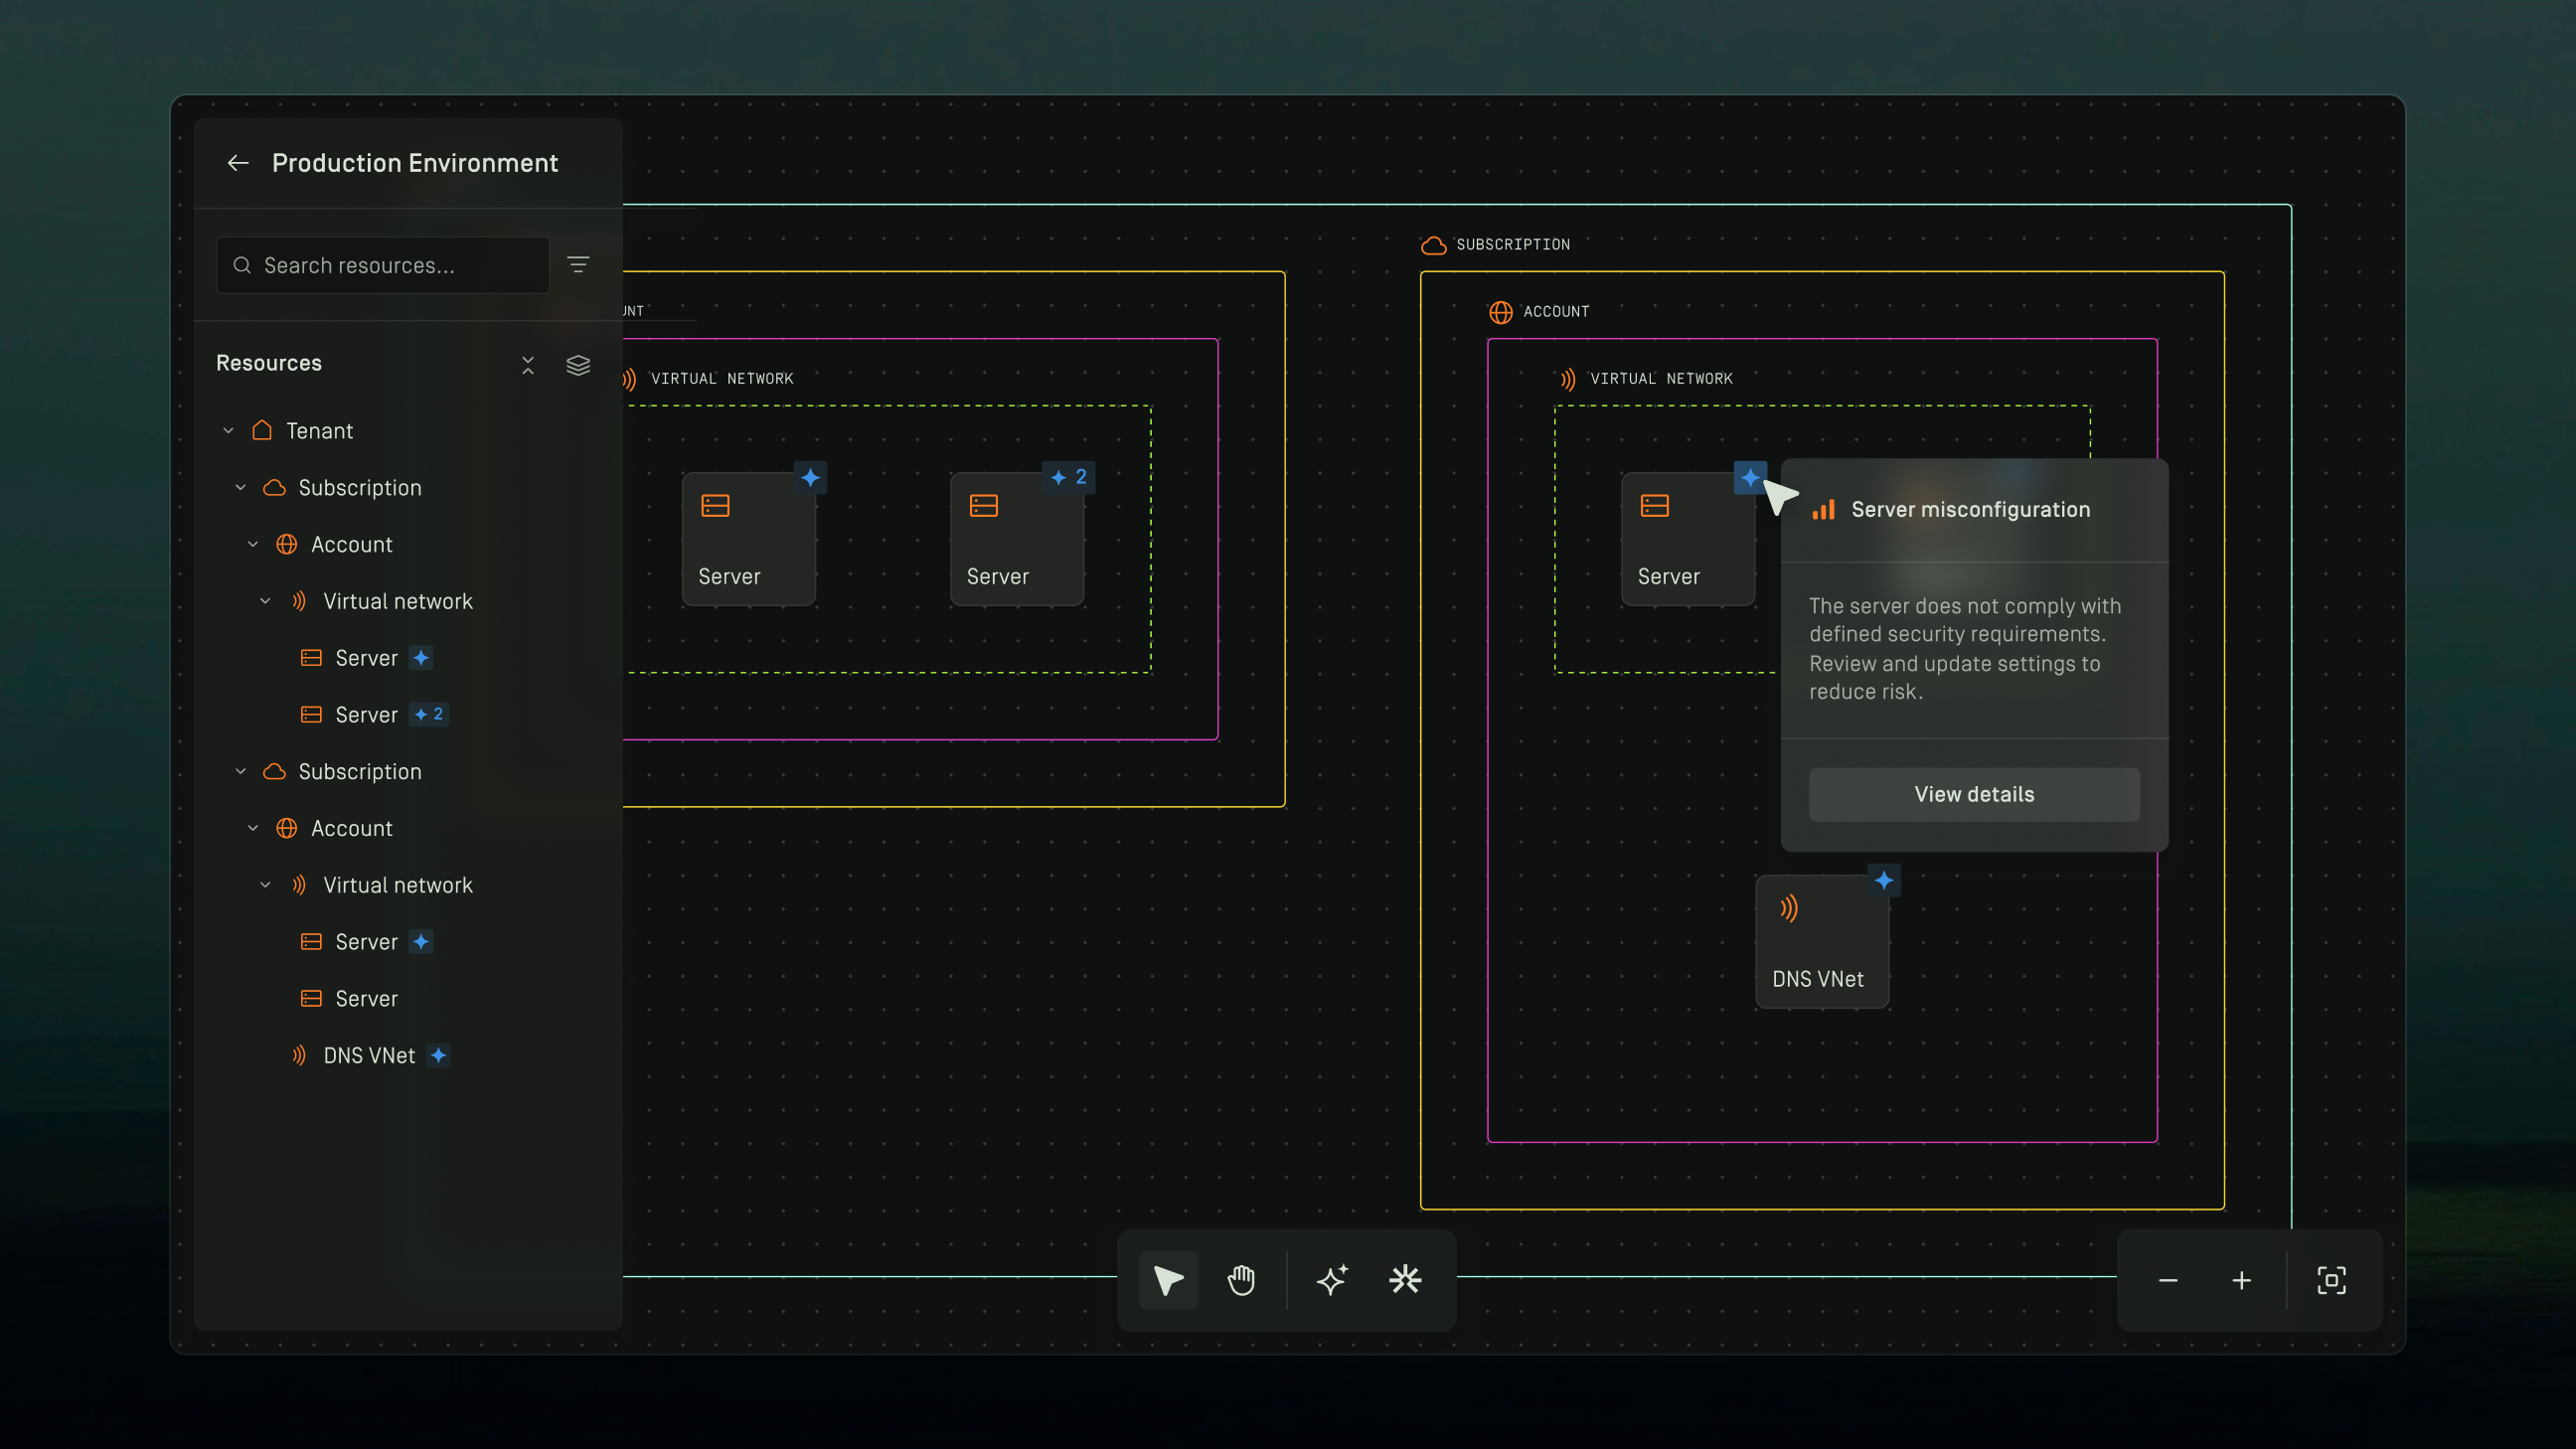
Diagram showing a central cloud service icon connected by arrows to Google Cloud, AWS, and Microsoft Azure logos.
02

Your environment 
visualized in structure

Explore how services, data stores, and supporting components are connected across your cloud environment on a dynamic architecture canvas.

  • Automatic resource grouping and layering
  • Advanced search and filtering
  • Deep resource configuration details
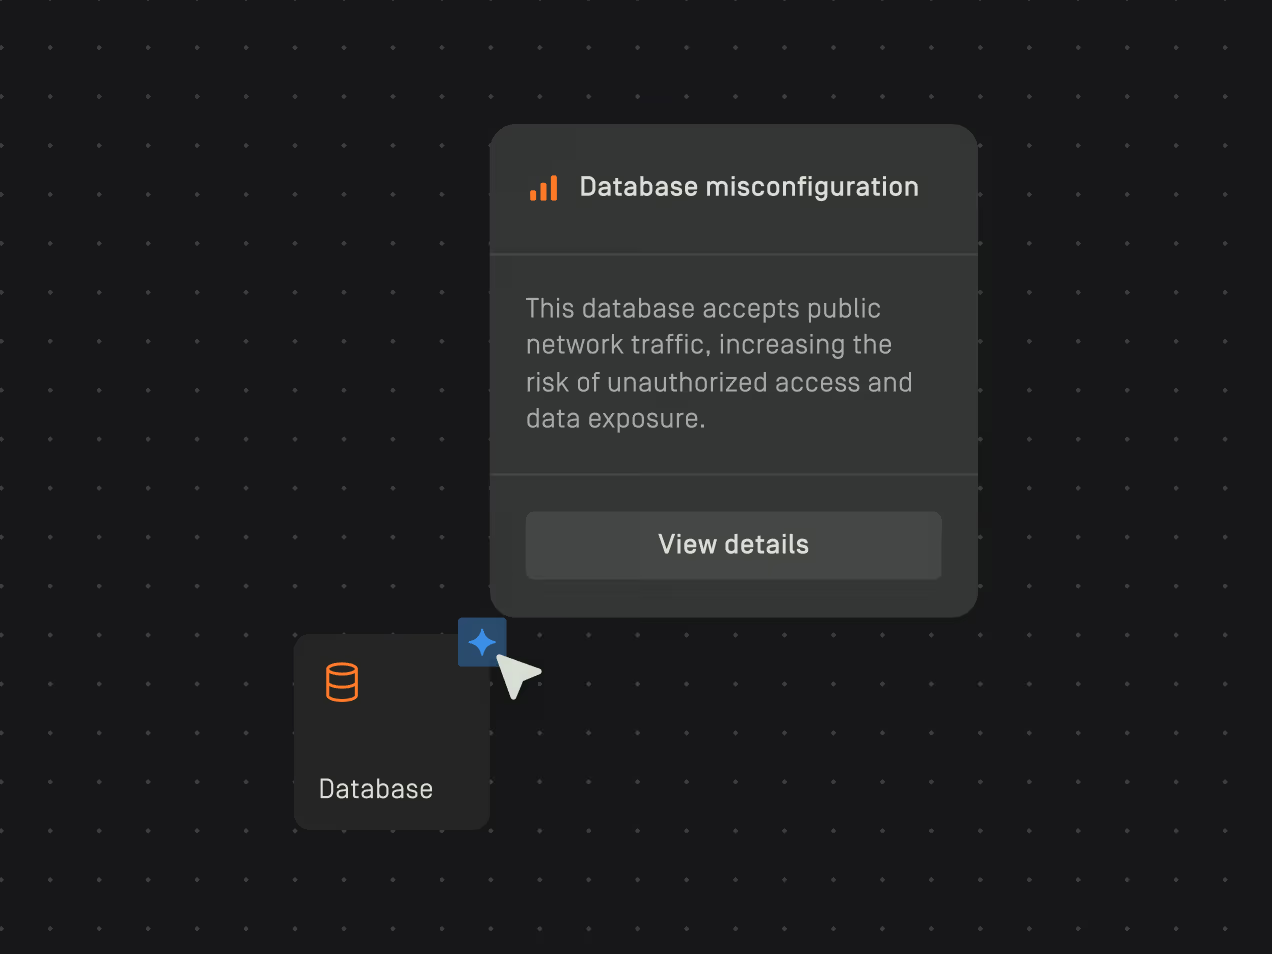
Diagram showing Data section with Database and Account, App section with Application, and Platform section with Cache and Vault components.
03

Context-aware insights across your environment

AI-driven insights help you analyze and identify security risks, misconfigurations, and optimization opportunities.

  • Insights tailored to your enabled requirements
  • Impact measured against your standards
  • Collaborative insight resolution workflows
Pop-up alert from Database icon warning of database misconfiguration allowing public network traffic and risk of unauthorized access.

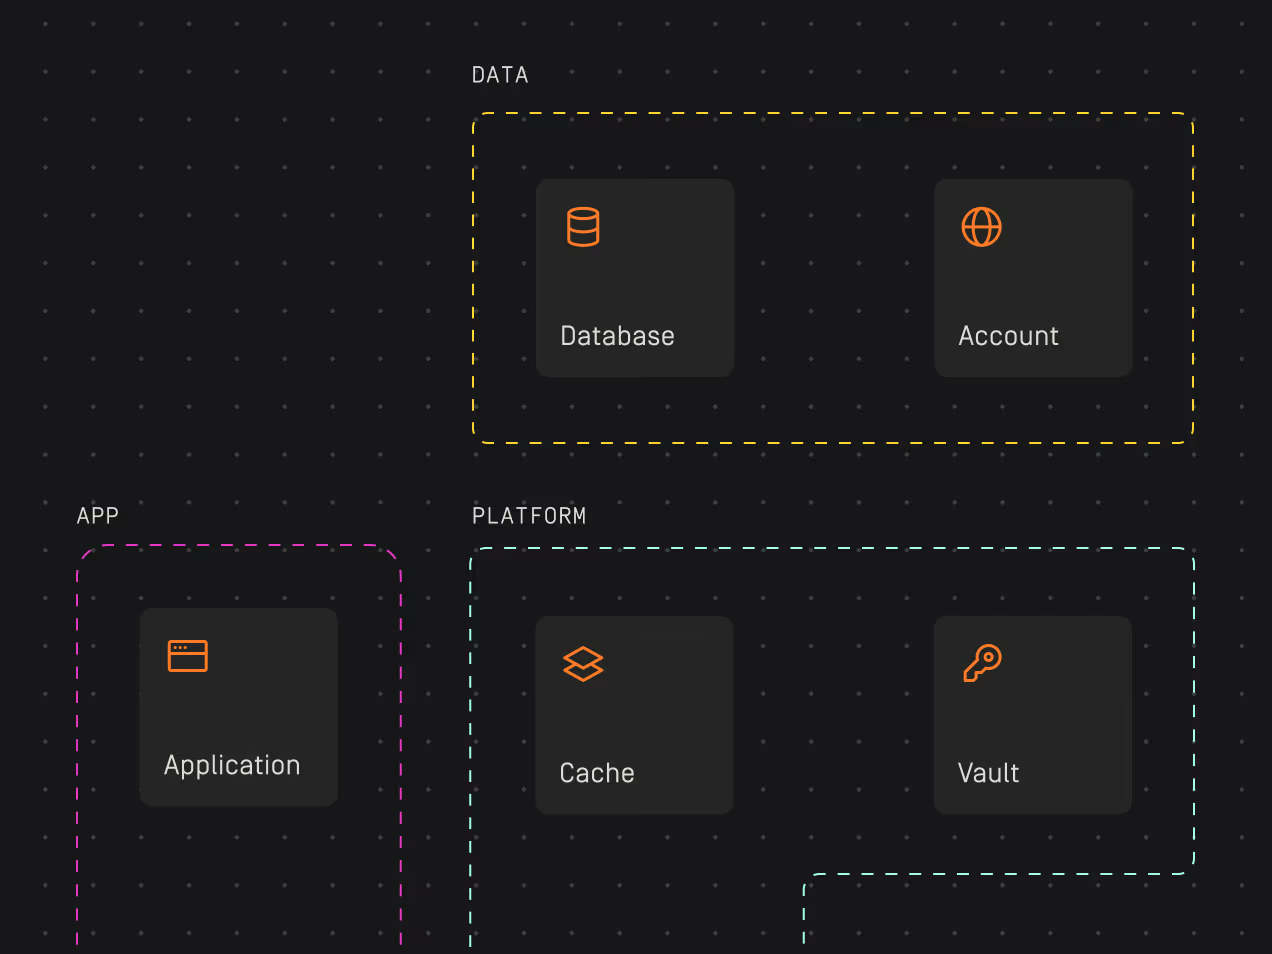
Explore your architecture with precision

Dark-themed user interface labeled Production Environment showing a resource list with Tenant, Subscription, Account, Virtual network, and multiple Servers including two with a blue star icon and one labeled with number 2.

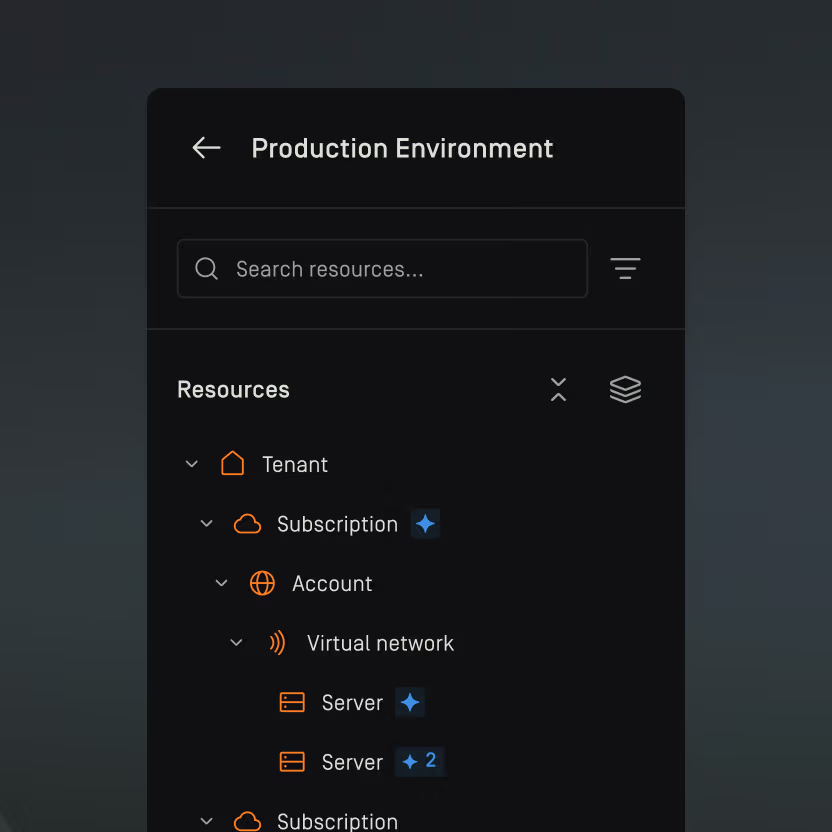
Powerful resource panel

Search and filter resources instantly

Toolbar with four icons including a highlighted arrow cursor, hand, sparkle, and snowflake on a blurred abstract background.

Intuitive architecture controls

Navigate complex environments with precision

Diagram showing a 'Service' node connected to a 'Cache' node below, with a 'Relations' panel listing Incoming connections from 'Database' and 'Server', and an Outgoing connection to 'Cache'.

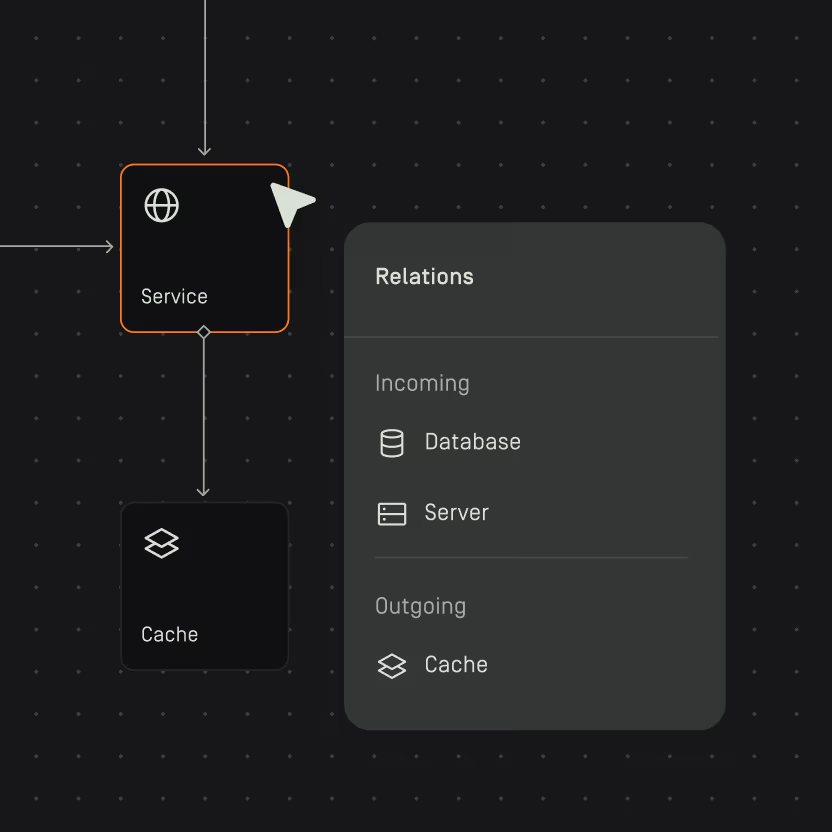
Visualized resource relations

See how services connect and depend on each other

Take control of your cloud security